CATALOG ECONOMICS
How to Analyze Bulk SKU Profitability
Use a clean import and an explicit cost model to compare which SKUs create contribution dollars, not just revenue.
- Published
- Reviewed
DIRECT ANSWER
The calculation in one paragraph
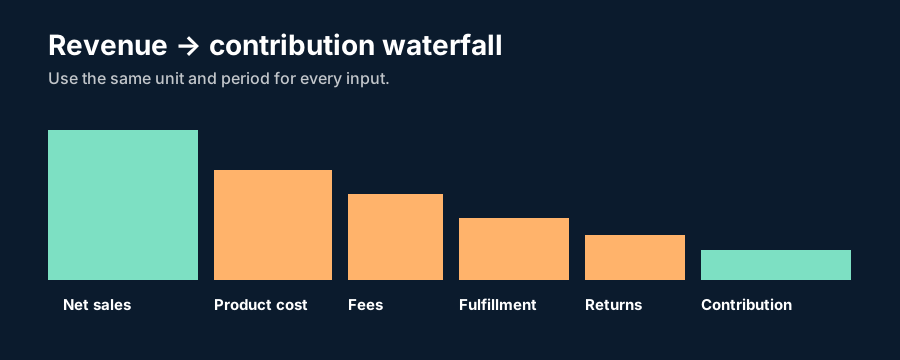
Bulk SKU profitability starts with a row per comparable SKU-period, then calculates net sales less product cost, payment or marketplace fees, fulfillment, shipping subsidy, expected returns, and attributable acquisition cost. Compare both contribution dollars and percentage; neither alone tells the whole decision.
Open the product profit and margin calculatorStart with one row and one period
Choose a consistent grain before importing: usually one SKU, channel, and period. A high-revenue SKU can look stronger simply because it sells more units, while a percentage alone can hide a small absolute contribution. Preserve the source export and document whether sales are units shipped, paid orders, or settled sales.
Normalize currency, units, and the period before comparing rows. Do not divide a monthly ad total by a lifetime unit count or compare a gross-sales export with a net-settlement fee field. Include discounts and refunds consistently so a return is not subtracted both from sales and again as a full cost.
Map costs deliberately
A practical import has columns for SKU, units, net sales, landed product cost, variable fulfillment, variable packaging, shipping subsidy, percentage fees, fixed fees, expected return cost, and attributable acquisition cost. Keep unsupported or fixed overhead in a separate column rather than silently assigning it to products.
Payment and marketplace fees often have a percentage and a fixed amount. Confirm the fee base in the current agreement and enter it separately where possible. Return cost should represent the expected net loss after recoverable inventory, reverse shipping, processing, and retained fees. This makes scenario changes visible instead of hidden in a single margin number.
Review outliers before acting
Sort by contribution dollars to find material wins and losses, then by contribution percentage to find fragile economics. Investigate surprising rows: missing costs, bundle allocations, different channels, seasonal markdowns, or a promotion cohort can all change the result. A negative contribution row is a signal to validate inputs before changing price or pausing spend.
Use a scenario column for shipping, fee, return, and ad-cost changes. The goal is not a false promise of precision; it is a documented comparison that can be updated when a supplier quote, carrier invoice, or platform rule changes. Keep original data and test a small import before using output in an operational system.
WORKED EXAMPLE
One SKU row
- Net sales: $1,000
- Landed product cost: $360
- Fees: $80
- Fulfillment and shipping subsidy: $160
- Expected return and acquisition cost: $220
$1,000 − ($360 + $80 + $160 + $220)$180 contribution; 18% contribution marginThe row can cover some fixed overhead, but it is not final accounting profit.
Recommended import columns
| Column | Why it matters |
|---|---|
| SKU and channel | Keeps unlike sales paths separate |
| Net sales | Revenue after the chosen discounts and returns treatment |
| Variable cost fields | Makes assumptions reviewable |
| Scenario fields | Shows sensitivity to uncertainty |
Download and visual reference
A practical workflow
- Export a comparable SKU-period from the source system.
- Map revenue and every variable cost to the same row basis.
- Calculate contribution dollars and contribution percentage.
- Filter and review missing values and unusual rows.
- Run return, fee, shipping, and acquisition scenarios before deciding.
EDGE CASES
Frequently asked questions
Should every shared expense be allocated to each SKU?
Use a separate fixed-cost view unless an allocation is necessary for a specific decision. Do not present an arbitrary allocation as a variable SKU cost.
How often should I refresh the analysis?
Refresh after material changes in prices, fees, carrier costs, return behavior, supplier terms, or the sales mix.